The Measurement Menu controls the measurement and shows the measurement data.
Note: If you switch to the MEASURE menu, the settings in the setup menu will be stored and provided by the next start of program.
Measurement Control

In the Measurement control it is possible to start the recording of the ADMA data by hitting the Record Button.
In addition, the RAM, CPU and HDD state will be shown.
Measurement Display

The current measurement data will be shown in the Measurement Display.
If the ready light turns green, start the Kalman filter calibration.
When the Kalman filter settled light turns green, the calibration is done successfully.
If the Kalman filter light is greyed out, this information will not be sent by the ADMA. Please set a newer ADMAnet data format in the AMDA.
GNSS State has been extended by the specific status and error bitfield of the GNSS receiver.
GNSS Raw Data lights indicate the status of the raw data received. The individual abbreviations stand for the different systems.
If the light is…
… red, no raw data has yet been received.
… orange, data has already been received but is not yet complete.
… green, all necessary data has been received to purchase correction data for the corresponding system.
Are all lights shown greyed out, the GPS raw data out is deactivated in the ADMA.
Therefore, activate it in the menu DATA of ADMA configuration.

If individual lights are greyed out, this satellite system is not supported by the GNSS receiver.
Warning:
If there is any change in the ADMA settings, you must push the button Load settings. You will find a detailed description of doing so in the article ADMA Setup.
Furthermore, the path of the measurement file is being displayed. The complete path will be shown by moving the mouse over the path.
With the lower arrows on the right side it is possible to display the data of the different configured POI’s.

On the upper right, you can choose between different measurement displays, if you press the left or right button.

Standard Display
You will find the most interesting measurement values in the Standard Display.

ADMA State Display
You will find the state and error bits, according to the ADMA, in the ADMA State Display. Every Bit has his own lamp. The illuminated lamp indicates, that the corresponding bit is set. State bits are green and the error bits are red. The only exception are the position and tilt quality bits. They illuminate in the colours red, yellow and green as descripted in the ADMA documentation.

GNSS State Display
You will find the state and error bits, according to the GNSS receiver, in the GNSS State Display.

ADMA-Speed Display
If the ADMA-Speed is connected to the Ethernet Logger, an additional part to the measurement display will be shown.
If the…
… armed-light is illuminated red, the ADMA-Speed is ready for braking.
… armed abort-light is illuminated red, the braking test was aborted.
… trigger-light is illuminated green, the brake paddle is pushed.
… reset-light is illuminated green, the reset the braking counter button is pushed.
After braking occurred, the results will be shown in the chart below the lights. This chart will be saved in a *.csv file in the folder which was selected in the setup.
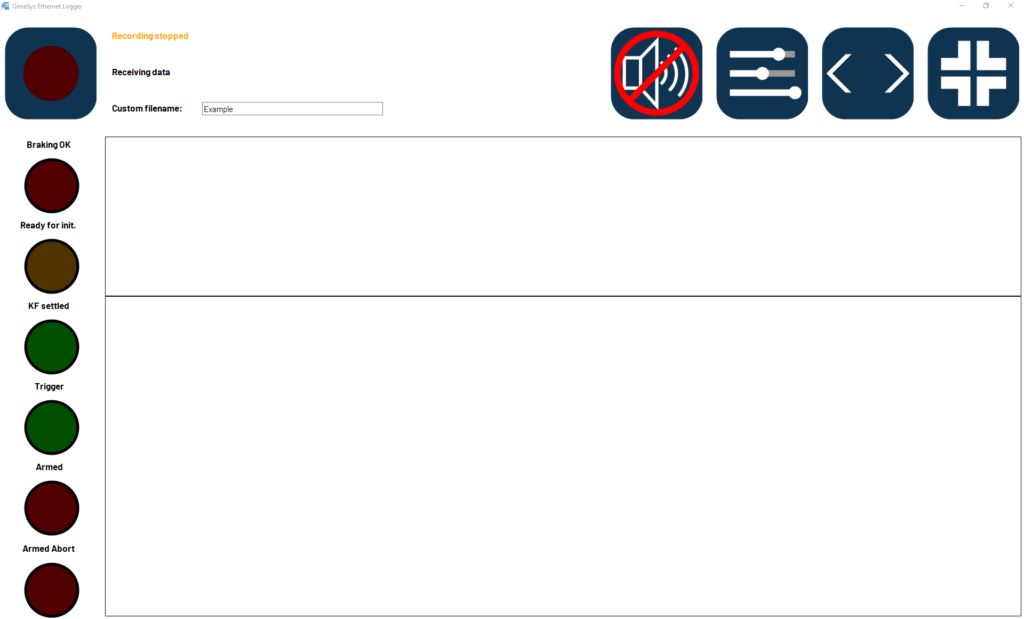
ADMA-Speed Display Full Screen
Measurement Control

In the Measurement control you can start the monitoring or recording of the ADMA data.
- Record-Button: If you press the record-button recording will be started.
- Sound ON/OFF: By pressing this button all braking sounds will be turned on or off.
- Editing numeric or braking table panel: By pressing this button the edit panel for your current visualization will be opened.
- Change between numeric or braking table panel: By pressing this button you will change the visualization between the numeric and braking table panel.
- Close full screen: By pressing this button the full screen panel will be closed. Alternatively, you can use the ESC-Button.
Light Panel
| Breaking OK: This indicates, if the estimated braking distance error is within the quality threshold which you can setup in the Braking Add-On via Webinterface. With pushing this light button, you can toggle this state manually. Ready for init.: This is the same lamp like in chapter Measurement Display. If the ready light turns green, start the Kalman filter calibration. KF settled: This is the same lamp like in chapter Measurement Display. If the Kalman filter light turns green, you can start the measurement. Trigger/Armed/Armed abort: These are the same lights like in chapter ADMA-Speed Display. If the trigger-light is illuminated green, the brake paddle is pushed. If the armed-light is illuminated red, the ADMA-Speed is ready for braking. If the armed abort-light is illuminated red, the braking test was aborted. |  |
Numeric Panel
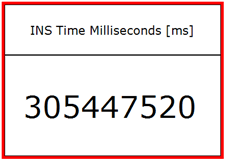
In the numeric Panel, up to nine measurement values can be displayed.
If you want to change the values, push the edit button.

Edit Numeric Panel
| In the Edit Numeric Panel, you can setup the numeric display. Selection of the number of numeric values which are displayed. There you can search for a specific measurement channel List of measurement channels which are available. Here you can load and save the settings of the numeric and braking table display. |  |
Selection of a channel:
When you activate the edit mode, you can select a numeric display by mouse click. A red border appears around the numeric display after selecting it. Now you can choose a channel in the list of measurement channels (Point 3). The selected channel will now be displayed in the selected measurement display. The red boarder will disappear after you closed the edit mode.

Braking Table
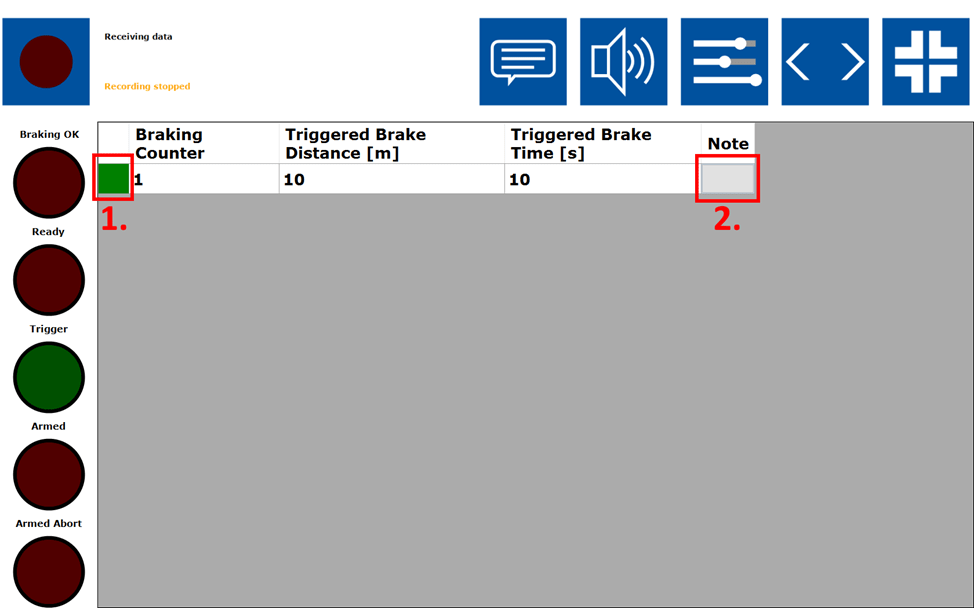
In the braking table you can display the braking results in a table.

In the image above are two markings.
- This button indicates, if a braking result is within or out of the estimated quality threshold. To change this state manually, click on this button. You can also push on the light Braking OK. Be aware that this light has an effect only on the last braking result.
The following colours are available:
green: Braking quality is within the estimated quality threshold.
lime: Braking quality was set manually to valid.
red: Braking quality is out of the estimated quality threshold.
orange: Braking quality was set manually to invalid.
You can also find this value in the saved braking table. The column Quality can contain the following values:
1 = green
2 = red
3 = lime
4 = orange
- With this button you can add predefined notes to this braking. Find more information in chapter Add On Braking Setup.
Edit Braking Table
| In the braking table edit panel, you can setup the columns of the braking table, which shall be displayed. List of measurement channels, which can be displayed in the braking table. These are the main braking data measurement channels. Here you can load and save the settings of the numeric and braking table display. |  |


