Configuration View
In this view, the measurement data get loaded and the set up for the Plot and the Sample Data Views.
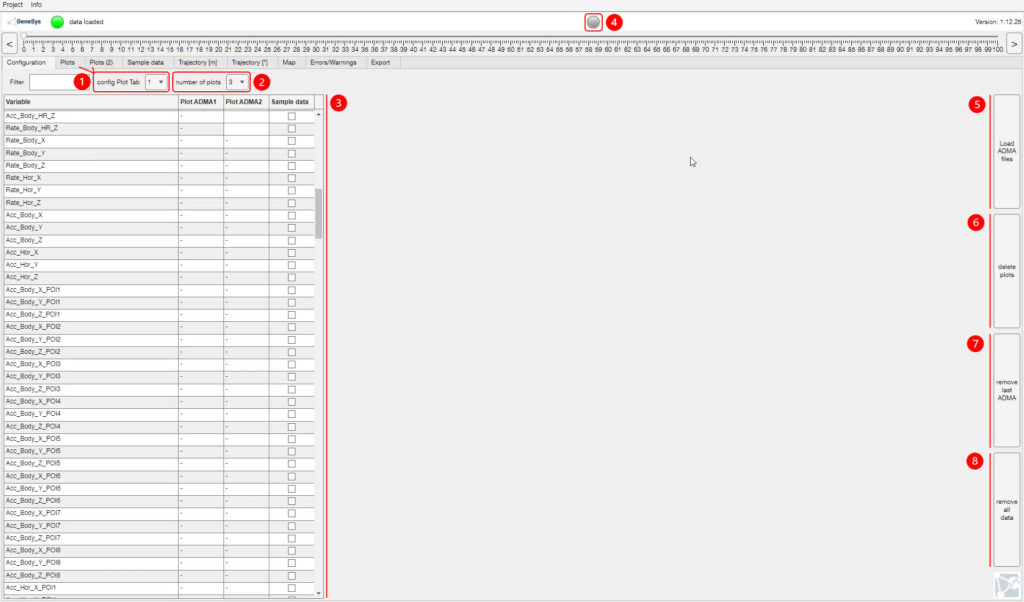
| Number | Description |
|---|---|
| 1️⃣ | Select the active Plot View to plot selected data channels. |
| 2️⃣ | Select the amount of plots to display in the selected Plot View. |
| 3️⃣ | In the data channel overview, channels of the different ADMA files can be selected for plotting and for the Sample Data view. |
| 4️⃣ | The Error and Warning LED is lightened red or orange, when Errors or Warnings are detected in the loaded ADMA data files. |
| 5️⃣ | Load Multiple ADMA data files. |
| 6️⃣ | Delete currenty selected plots. |
| 7️⃣ | Delete last added ADMA file. |
| 8️⃣ | Remove all ADMA data files. |
Plot View
This View allows analyzing selected data channels of multiple ADMA systems in parallel.
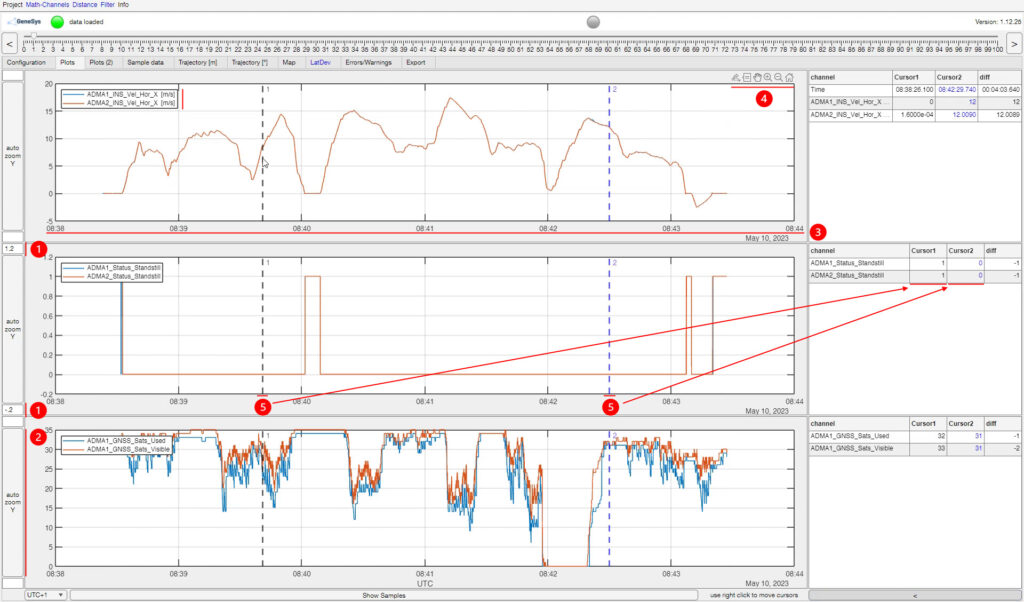
| Number | Description |
|---|---|
| 1️⃣ | Manual y axis min / max value configuration. |
| 2️⃣ | Set automatic y axis resolution. |
| 3️⃣ | Contains time information as x-axis. The x-axis of all plots get synchronized. |
| 4️⃣ | Navigation menue for navigating and zoomin in the single plot views. The view can be set to default and the diagram can be saved / copied as different graphic types. |
| 5️⃣ | Cursors for viewing single sample values and getting the difference. By clicking in between the cursors, the view gets zoomed into the specified area. |
Sample Data View
In the Configuration View, data channels can be selected for the Sample Data View.
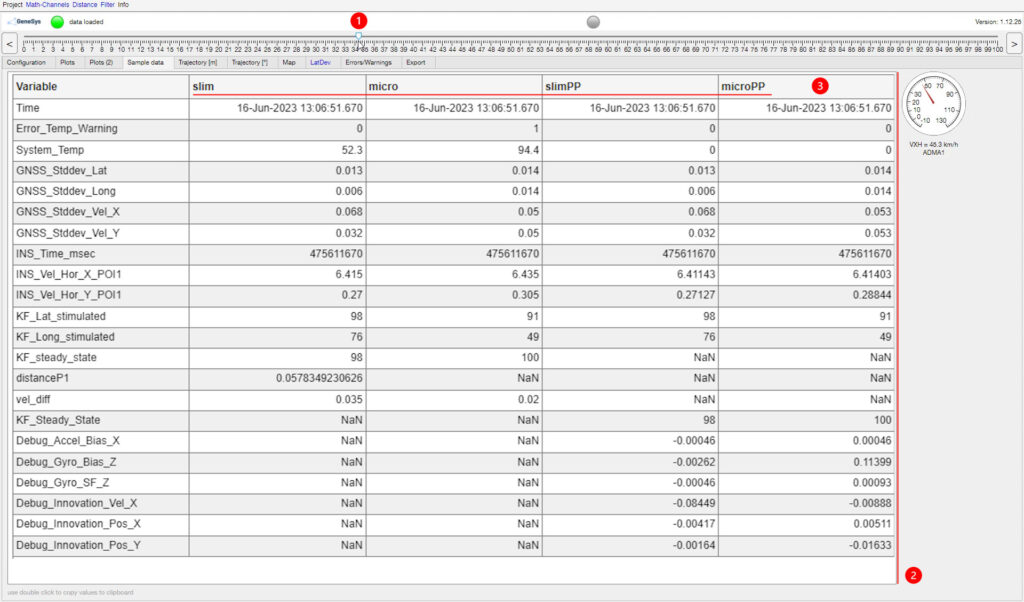
| Number | Description |
|---|---|
| 1️⃣ | The cursor can be moved in the timeline for displaying the current values in the Sample Data table. |
| 2️⃣ | The Sample Data table shows the current values of the selected data channels. By clicking on specific value cells twice, the value gets copied to the clipboard. |
| 3️⃣ | Names of the different data records. The naming of the data records within the Data Analyzer can be changed by double clicking the desired name. |
Relative Trajectory View
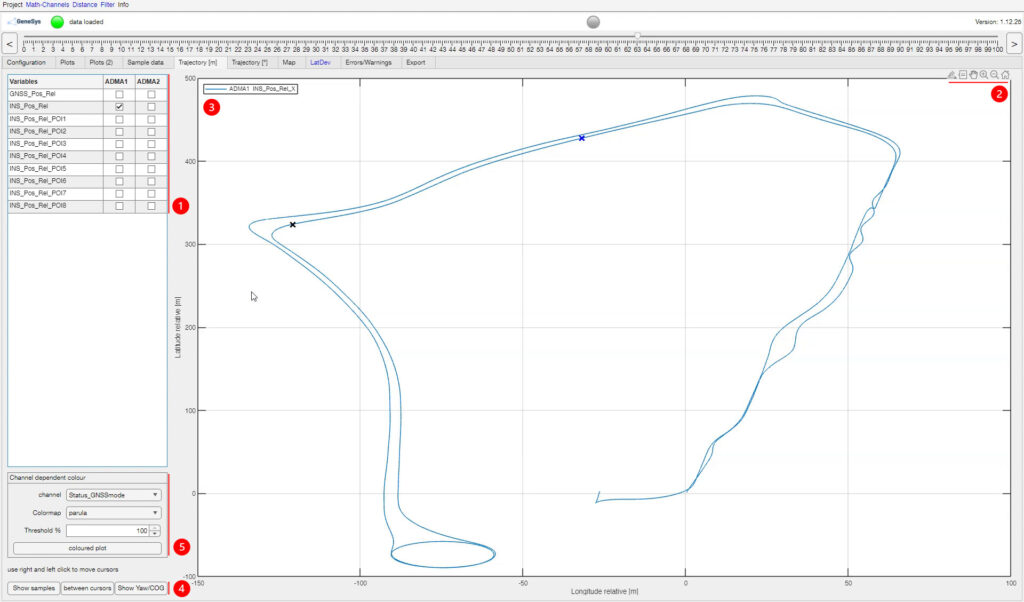
In this view, trajectories of the relative position data can be generated.
| Number | Description |
|---|---|
| 1️⃣ | Selection of the relative data to plot. It is possible to select the GNSS raw position data, the INS data in the MRP and all the different POI’s. |
| 2️⃣ | Navigation menue for navigating and zoomin in the trajectory view. The view can be set to default and the diagram can be saved / copied as different graphic types. |
| 3️⃣ | Diagram legend. |
| 4️⃣ | In this function section, displaying samples, only showing data in between the set cursors and displaying the heading as vector at the current cursor position can be activated. |
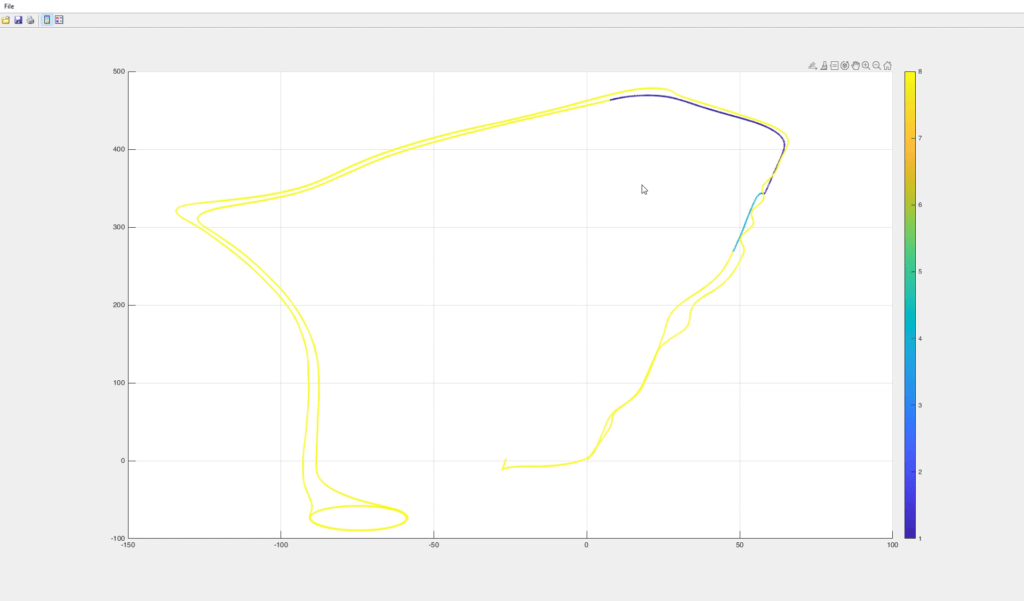
| 5️⃣ | Colored Trajcetory plots can be generated. This means single data channels can be visualized as a colored overlay on the trajectory. In the graphic below, the GNSS Mode was overlayed. With this plot it is easy to detect GNSS outages for example. |
Absolute Trajectory View
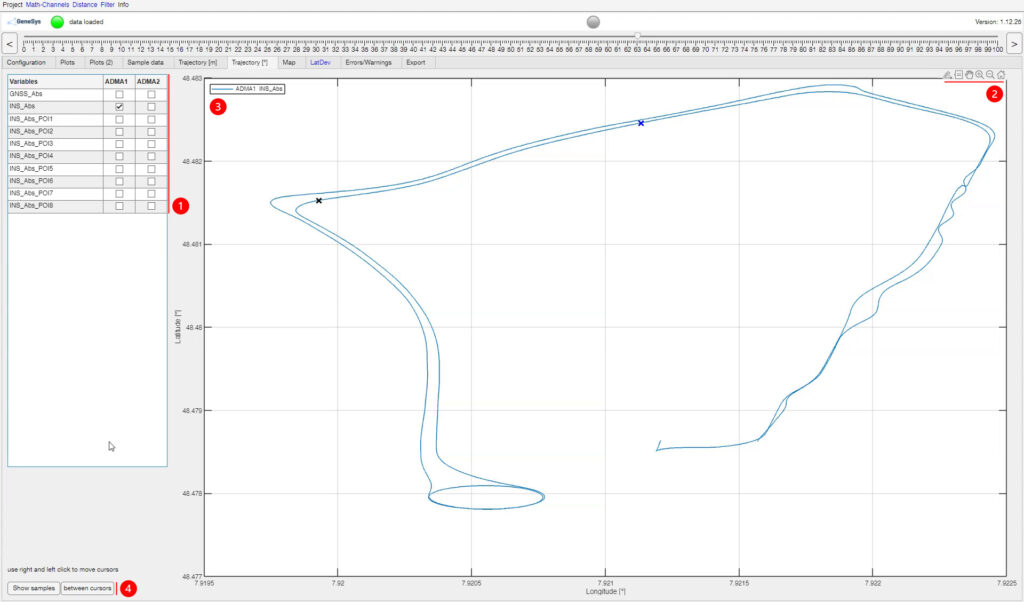
In this view, trajectories of the absolute position data can be generated.
| Number | Description |
|---|---|
| 1️⃣ | Selection of the absolute data to plot. It is possible to select the GNSS raw position data, the INS data in the MRP and all the different POI’s. |
| 2️⃣ | Navigation menue for navigating and zoomin in the trajectory view. The view can be set to default and the diagram can be saved / copied as different graphic types. |
| 3️⃣ | Diagram legend. |
| 4️⃣ | In this function section, displaying samples and only showing data in between the set cursors can be activated. |
Map View
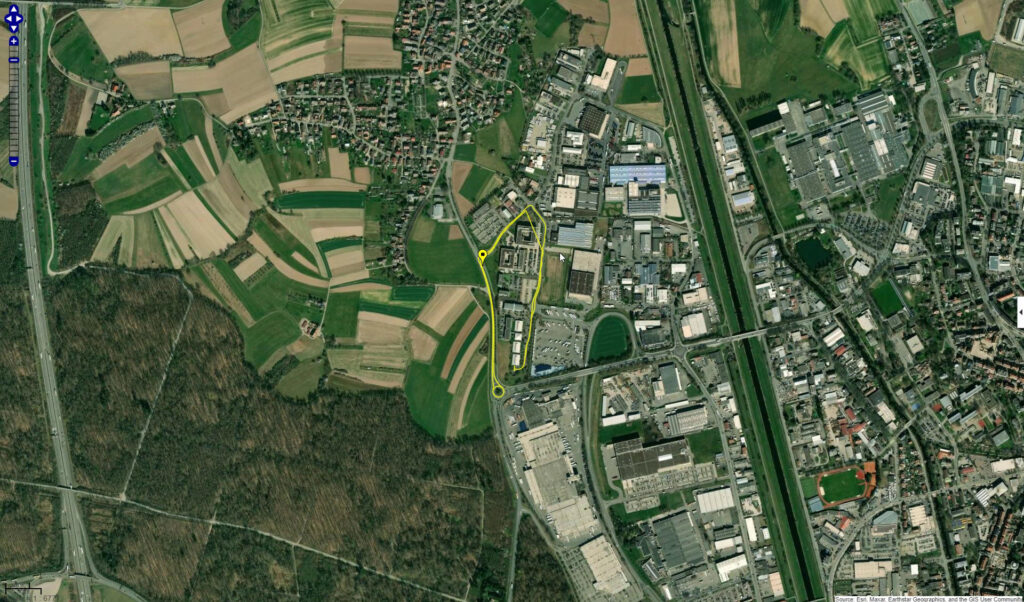
In this view, trajectories of the absolute position data can be displayed on open street maps.
Note: Please care, the open street maps may have offsets because of the map accuracy.
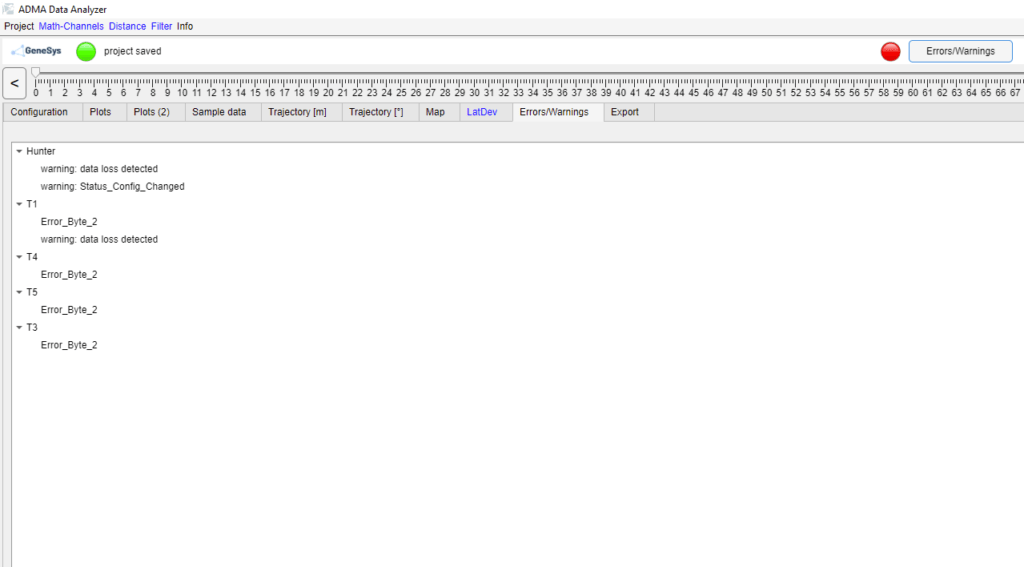
ErrorsWarnings View
This tab shows errors and warnings in case of occurence.
Export View
This view allows exporting the measurement data as csv, gsda or matlab files. Additionally trajectory data can be saved as kml files.
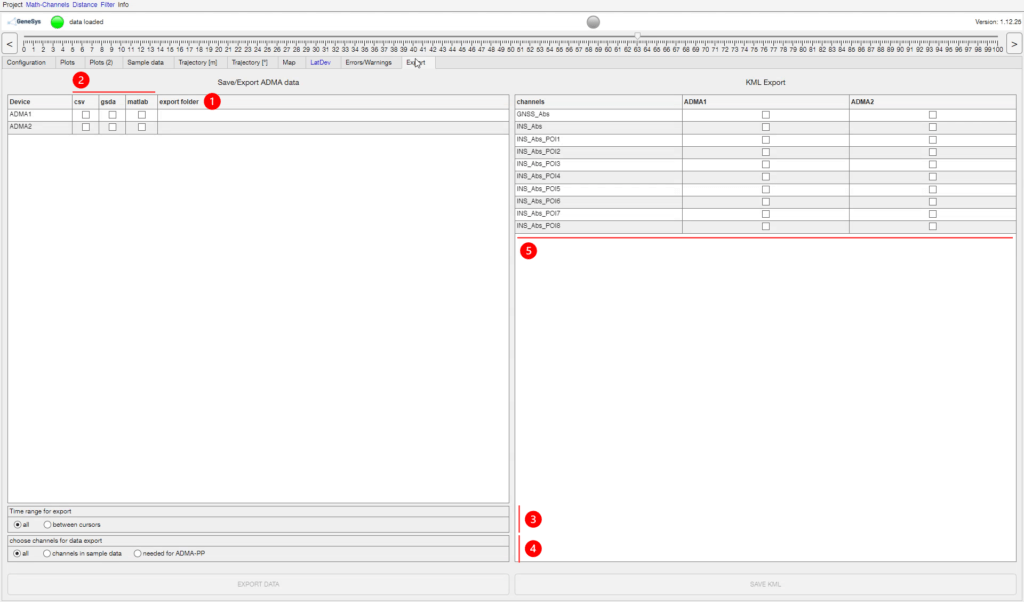
| Number | Description |
|---|---|
| 1️⃣ | Definition of the folder location to save the exported data in. |
| 2️⃣ | Selection of the different file formats. |
| 3️⃣ | It is possible to exort all data or only data in between the blue and black cursor. |
| 4️⃣ | Definition, which data channels should be exported. |
| 5️⃣ | Selection of trajectories to save as kml. |


