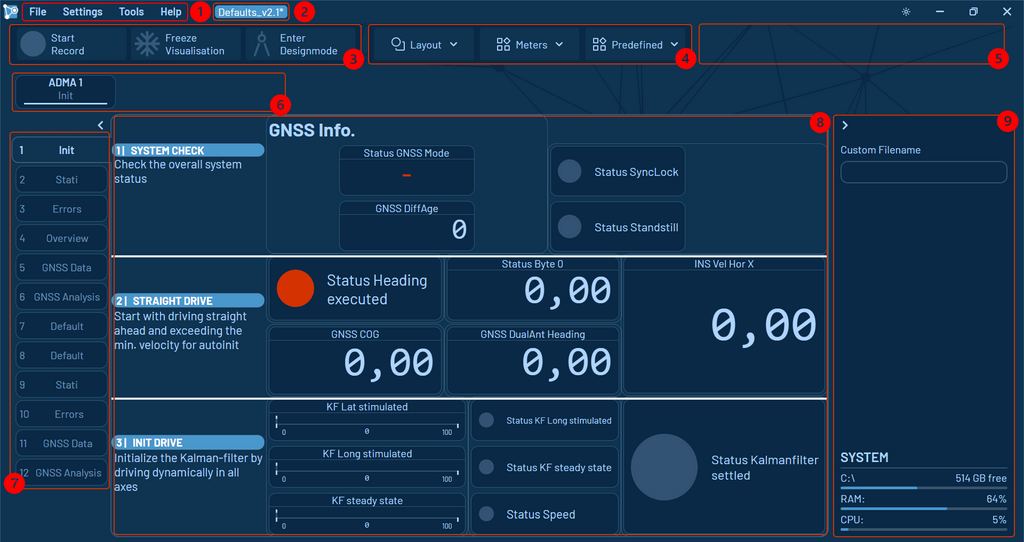
1️⃣ Context menu
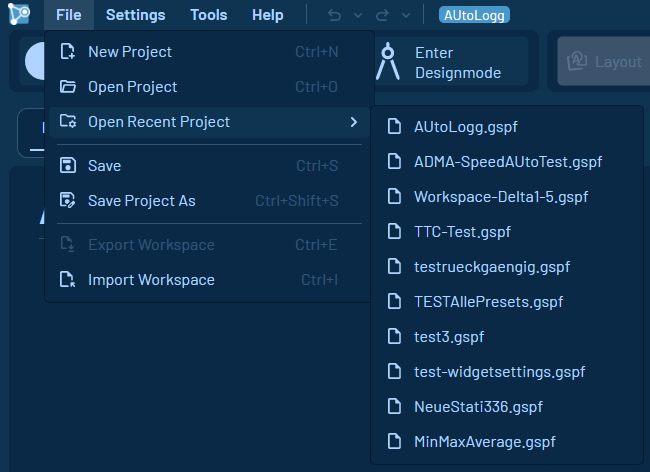
| New Project | Opens a new empty project |
| Open Projectㅤ | Open a saved project |
| Open Recent Project | Shows a list of the last used projects that can be selected |
| Saveㅤㅤㅤㅤ | Quick save of the current session in the selected project (2️⃣ in the overview graphic) |
| Save Project Asㅤㅤㅤㅤㅤㅤㅤㅤㅤㅤㅤㅤㅤㅤㅤㅤㅤㅤㅤㅤㅤㅤㅤㅤㅤㅤㅤㅤㅤㅤㅤㅤ | Save the current session in another project file than shown at the top of the screen (2️⃣) |
| Export Workspace | Opens the Export dialog, in which workspaces and their tabs can be selected for export as workspace file (.gsws) |
| Import Workspace | Opens the Import dialog, in which workspaces and tabs can be selected from the opened workspace file (.gsws) for import. |
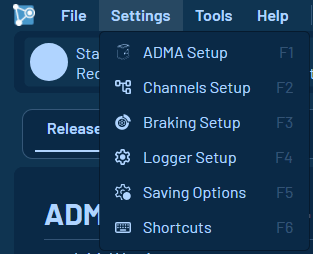
| ADMA Setup [F1]ㅤㅤㅤㅤㅤㅤㅤㅤㅤㅤㅤㅤㅤㅤㅤㅤㅤㅤㅤㅤㅤ | Opens the ADMA Setup dialog, in which the used ADMA systems can be added with their IP-addresses. |
| Channels Setup [F2] | In the Channels dialog, the data channels of the different data streams can be enabled / disabled for further usage in the workspaces and widgets. |
| Saving Options [F3] | Different saving options, like file name, saving location and data formats to record can be configured here. |
| Braking Setup [F4] | In the Braking Setup, different sounds can be assigned for all the different braking stages / events. |
| Logger Setup [F5] | The Logger Setup allows to personalize the color scheme, data units and different overall settings of the software. |
| Shortcuts [F6] | Here you can find a simple overview table of all available shortcuts. |

| GS Converterㅤㅤㅤㅤㅤㅤㅤㅤㅤㅤㅤㅤㅤㅤㅤㅤ | The GS Converter allows to convert binary raw data (.gsdb) to ASCII (.gsda) or to extract the ADMA configuration file(s) from binary data (.gsdb). |
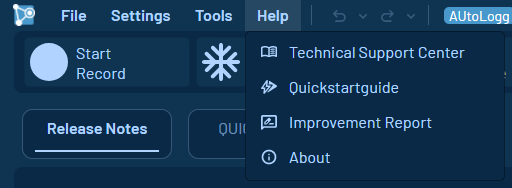
| Technical Support Centerㅤㅤㅤㅤ | Link to the Technical Support Center. |
| ㅤㅤㅤ ㅤㅤ ㅤㅤQuickstartguideㅤㅤㅤㅤㅤㅤㅤㅤㅤㅤㅤㅤㅤㅤㅤㅤㅤㅤㅤㅤㅤㅤㅤㅤㅤㅤㅤㅤㅤㅤ | If the Quickstartguide Workspace got closed, you can reopen it here. |
| Improvement Report | Gives you the opportunity to report bugs or to suggest new feature ideas. |
| About | Shows the software relevant information, like license, version and contains the function to reopen the „What’s new“-Workspace. |
2️⃣ Project Name
At the topside of the software, the current project name is shown. When opening the ADMA Data Logger, the last project will be loaded per default.
3️⃣ Function Bar
In the function bar at the top left side of the software there are three different buttons:

For setting up your workspaces and measurement tabs with different widgets and data channels of the ADMA, the Designmode has to be enabled. Only in this state, data channels can be assigned and widgets can be added and moved.

As soon as the Logger receives an ADMA data stream, the data recording can be started and the configured data formats get recorded, as long as this button is active.

With the freeze function, it is possible to freeze the visualization screen.
Note: This doesn’t affect the data recording.
For saving space, it is possible to minimize this function bar to the icons only. For that just hover over the function bar and hit the small arrow on the right border of it.
4️⃣ Widget bar
At the widget bar, you can select from different widgets from the available groups and add them to the current workspace measurement tab. It is possible to put widgets to your favorites (5️⃣) by clicking the empty star icon. The Widgets can be added by clicking or via drag and drop.
6️⃣ Workspace Bar
In the workspace bar, different workspaces can be used. While the Design Mode is active, new workspaces can be added, renamed and the order of all workspaces can be changed with drag and drop.
Within the workspaces there is a nother layer, the 7️⃣ tabs. In the Design Mode new tabs can be added, renamed and changed in order by draging and dropping. Within these tabs all available widgets can be used for setting up your own 8️⃣ views.
9️⃣ Status / Channel Row
When Design Mode is active, the Channel Row displays all available data channels from connected devices. These channels can be assigned to various widgets. Only the data channels enabled in the „Channel Setup“ section are selectable and recorded during Recording Mode.
When Design Mode is disabled, the Status Row becomes visible, showing the current PC’s disk space and CPU usage.

